Reprinted with permission from The Everly Report
In the U.S., there are two types of meningococcal vaccines that may be given to children between the ages of 11-18 years of age: MenACWY and MenB. MenB is not yet routinely given or recommended in the US, and should only be offered if your child is considered to be at an increased risk (i.e. asplenia or persistent complement component deficiencies). For that reason, we will focus here on the MenACWY vaccine.
MENINGOCOCCAL DISEASE
The MenACWY vaccine is typically administered once at age 11-12 and again at age 16 (two doses, total). There are currently three different brands of MenACWY vaccines licensed for use in the United States: Menactra (manufactured by Sanofi), MenQuadfi (Sanofi), and Menveo (GSK). (Package inserts are linked for each vaccine.)
Each vaccine insert states that MenACWY vaccines are “indicated for active immunization to prevent invasive meningococcal disease caused by Neisseria meningitidis serogroups A, C, Y, and W-135?. (Emphasis mine.)
For clarification, from eziz.org, an educational website for California’s VFC (Vaccines for Children) program:
“Are there different types of meningococcal disease?
There are at least 12 types, called serogroups, of N. meningitidis. Serogroups B, C, and Y cause most of the infections in the United States. Serogroups A and W are more common in other parts of the world.”
“What is meningococcal disease?
Meningococcal disease is a rare, but extremely dangerous illness caused by certain bacteria (Neisseria meningitidis). About 1 in 10 people have these bacteria in their noses or throats but are not ill. These people can spread the bacteria to others during close or lengthy contact, especially if living in the same household. Coughing, sneezing, kissing, and sharing drinks are all ways the bacteria can be spread.
Those who become sick suffer from blood poisoning or meningitis, which is inflammation and swelling around the brain and spinal cord. Even when treated, meningococcal disease kills 1 out of 10 cases. Of those who survive, up to 1 in 5 will suffer long-term disabilities such as hearing loss, brain damage, loss of arms or legs, or severe scarring of the skin.”
The paragraph above likely sparks some concern, but let’s back up and dig a little deeper.
If you were to google search “meningococcal disease”, you’d easily find information similar to the above, along with sources claiming the meningococcal vaccine is responsible for the decline in incidence and therefore mortality of meningococcal disease.
But what is the actual evidence behind these claims?
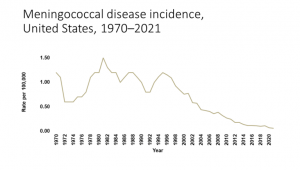
The CDC graph here presents the incidence of meningococcal disease in the US, per 100,000 population, starting in 1970.
In 2018, for example, there were less than 330 cases of meningococcal disease in the United States (population 326.8 million in 2018). That’s a 0.0001% chance of contracting meningococcal meningitis, or 1 case per 1 million people living in the US. There were a total of 39 deaths attributed to meningococcal disease in 2018.
Of course, some reading, are thinking: “But the vaccine is responsible for the decline in meningococcal disease, and that’s why the incidence is so low. If we didn’t vaccinate, more people would contract this disease and die from it.”
This is the rationale for every infectious disease for which, we have a vaccine. And that’s likely why the CDC’s graph of meningococcal disease incidence neither includes data prior to 1970, nor indicates when the meningococcal vaccines were first introduced (2005).
In 1970, the US population was 203.4 million and the incidence of meningococcal disease was 1.2 per 100,000 persons. Therefore, around 2,440 individuals out of 203.4 million contracted the infection, in 1970. According to the National Meningitis Association, 10-15% of individuals who contract meningococcal disease will die even with treatment. Using 15% as the death rate, there were up to 366 deaths in the US due to meningococcal disease, and the risk of dying of meningococcal disease in the US was around 1 in 555,000, in 1970. If 20% of meningococcal disease cases end up with long-term disabilities, that’s 488 individuals ending up with long-term disabilities from meningococcal disease.
366 deaths + 488 with long term disabilities = 854 individuals died or were permanently affected by meningococcal disease in 1970, three and a half decades before the vaccine was introduced (this rate is 0.4 per 100,000 persons). This means 99.99958% of the population was unaffected by meningococcal disease in 1970. Adding up that risk over an entire lifetime (75-80 years) at that rate (0.0042% per year), this means 0.03% of the population may die or be permanently injured by meningococcal disease over an 80-year time period based on the rate of harm, in 1970.
This is far, far less than influenza and other flu-like illnesses. To put this into perspective, in the year 2021, over 1200 women died in childbirth in the US (33 women for every 100,000 live births) and deaths due to choking was 1.6 per 100,000 population (vs 0.4 per 100,000 for meningococcal disease).
What about the data prior to 1970?
The graph below is taken from a published study on trends in meningococcal disease in Oklahoma and the United States, and presents incidence rates from 1955 to 2006.
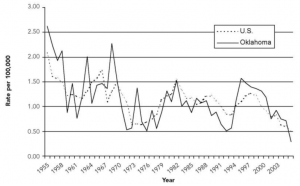 This graph looks much different than the one from the CDC website, primarily because of the years of data prior to 1970 that the CDC chose to exclude from their graph. The CDC’s graph starts with data from 1970, about half way down from a peak in incidence in 1969. (Additional data from 1955-1970 in red.)
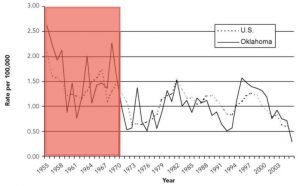 Cutting the historical data off at 1970 is unfair to anyone trying to understand the overall trend in meningococcal disease incidence, because it makes the trend look relatively level until 2005, rather than seeing the longer term trend, which is a decline in incidence and magnitude of outbreaks:
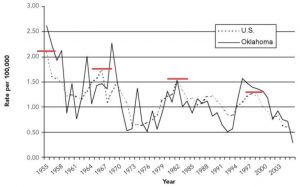 While the incidence of meningococcal disease has risen and fallen over the decades, it’s clear from the graph above that there has been a downward trend since 1955. Looking even further back, an article published in 1952 notes that the number of reported cases in the US per 100,000 population, was 2.7 in 1951. Therefore, peaks in incidence occurred in 1951, 1966, 1981, and 1997 (every 15-16 years). Thankfully, the same study also included incidence rates for earlier years.
The graph below combines the two previous graphs, plus data points from the 1952 study.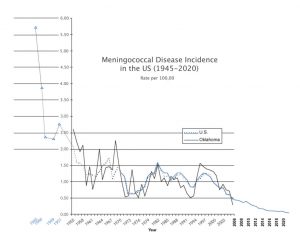
As you can see, the incidence of meningococcal disease has historically been quite high, and like many other infectious diseases, incidence (and therefore mortality) declined dramatically along with improvements in nutrition, sanitation, hygiene, disinfecting water sources, etc. prior to the introduction of nearly all vaccines in use today. More on the decline in infectious diseases and necessity of vaccination, here.
Of course, this information doesn’t prevent government regulatory agencies and other organizations from continuing to claim that vaccines are responsible for saving us from dying of infectious diseases.
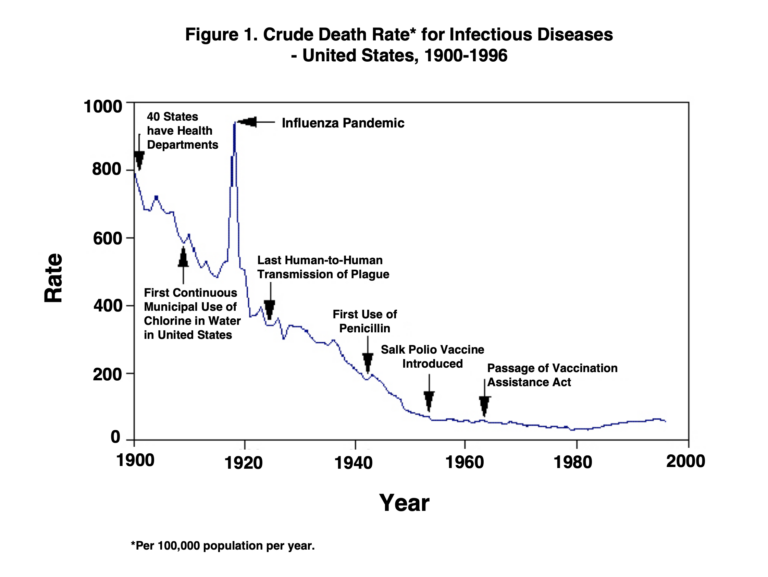 From the National Meningitis Association: “Historically, the number of meningococcal disease cases went up and down over time. Now, the number of cases is at the lowest it has ever been. Health officials believe this is due, in part, to the increased use of meningococcal vaccines.”
Now that we’ve seen the historical data, this statement really side-steps a lot of important information, doesn’t it?
So, how much of an impact did the meningococcal vaccine actually have on the decline in meningococcal disease?
Can we know?
Read the full article here. The Everly Report goes into more detail of the history of this vaccine (from 2005), the safety protocol and a case study of a teen girl who had adverse events as a result of the vaccine.
++++++++++++++++++++++++++++++++
 Like what you’re reading on The Tenpenny Report? Share this article with your friends. Help us grow.
Get more of Dr. Tenpenny’s voice of reason at her website.
Join our list here
++++++++++++++++++++++++++++++++

